Introduction to the Wave Trend Oscillator
Experience a smoother trading experience with the Wave Trend Oscillator, a powerful tool designed to reduce noise in your trading decisions. Unlike traditional RSI or Stochastic indicators, this oscillator employs a sophisticated smoothing algorithm to provide clear and flowing wave patterns, helping you identify trend reversals with precision.
Features of the Wave Trend Oscillator
- Visual Clarity: Easily spot momentum shifts with the crossover of the Green and Red lines.
- Less Noise: The smoothing calculation reduces false signals significantly compared to standard tools.
- Divergence Hunter: Excellent for spotting Divergence where price and oscillator patterns differ.
- Dual Purpose: Suitable for both scalping on M5 and swing trading on H4/D1 timeframes.
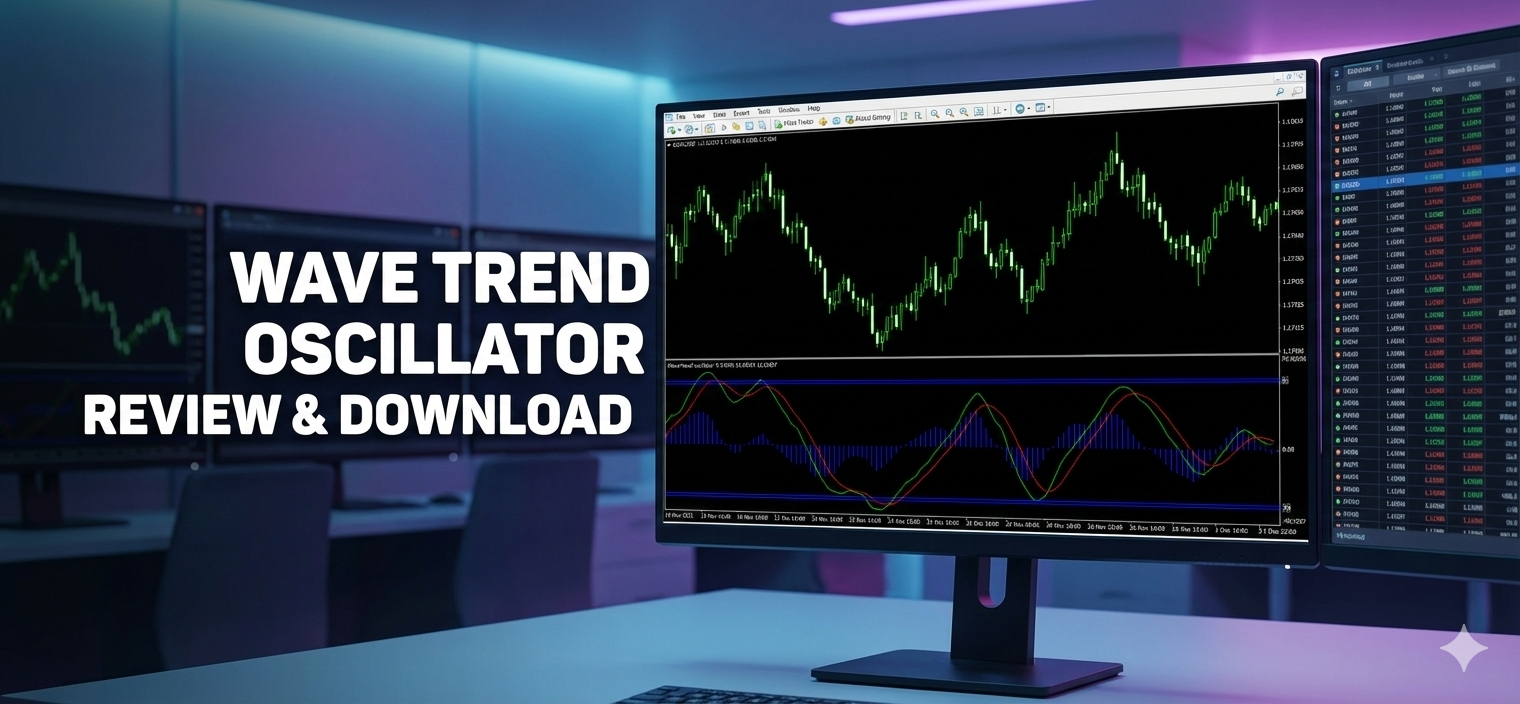
Using the Wave Trend Oscillator
The Wave Trend Oscillator is composed of several key components:
- Oscillator Lines: The Green Line (Fast) shows current price momentum, while the Red Dotted Line (Signal) offers a smoothed version.
- The Histogram: Blue bars indicate trend strength, with shrinking bars suggesting a weakening trend.
- The Zones: Horizontal lines indicate overbought (+53 / +60) and oversold (-53 / -60) zones.
Installation Steps for MT4
- Download the .ex4 file.
- Open MetaTrader 4.
- Navigate to File > Open Data Folder > MQL4 > Indicators.
- Paste the downloaded file.
- Restart MT4 or refresh the Navigator panel.
- Drag the Wave Trend Oscillator onto your chart.
Customizing for Volatility
Adjust the oscillator’s settings to match your trading style:
- Channel_Length: Default is 10, increase to 14 or 20 for swing trading.
- Average_Length: Default is 21, decrease to 10 for faster scalping signals.
- Overbought/Oversold Levels: Adjust to 70 and -70 for trading extreme reversals.
Effective Trading Strategies
The ‘Deep Value’ Buy Setup
Ensure the long-term trend is up by checking if the price is above the 200 EMA. Look for the oscillator to enter the oversold zone (below -50) and buy when the Green Line crosses above the Red Signal Line.
The ‘Peak Reversal’ Sell Setup
In a downtrend, confirm the price is below the 200 EMA. Sell when the oscillator enters the overbought zone (above +50) and the Green Line crosses below the Red Signal Line.
Pro Tip: Look for Divergence at the 200 EMA for a high-probability setup.